In a recent brief testing consulting, I noticed a recurring trend: many testing activities were being treated as mere formalities.
Some were skipped entirely, while others were finished with just a couple of perfunctory lines.
So I try to write about Test Result Reporting. Here are my thoughts.
Main Title : Approaching Test Reporting at three types of view.
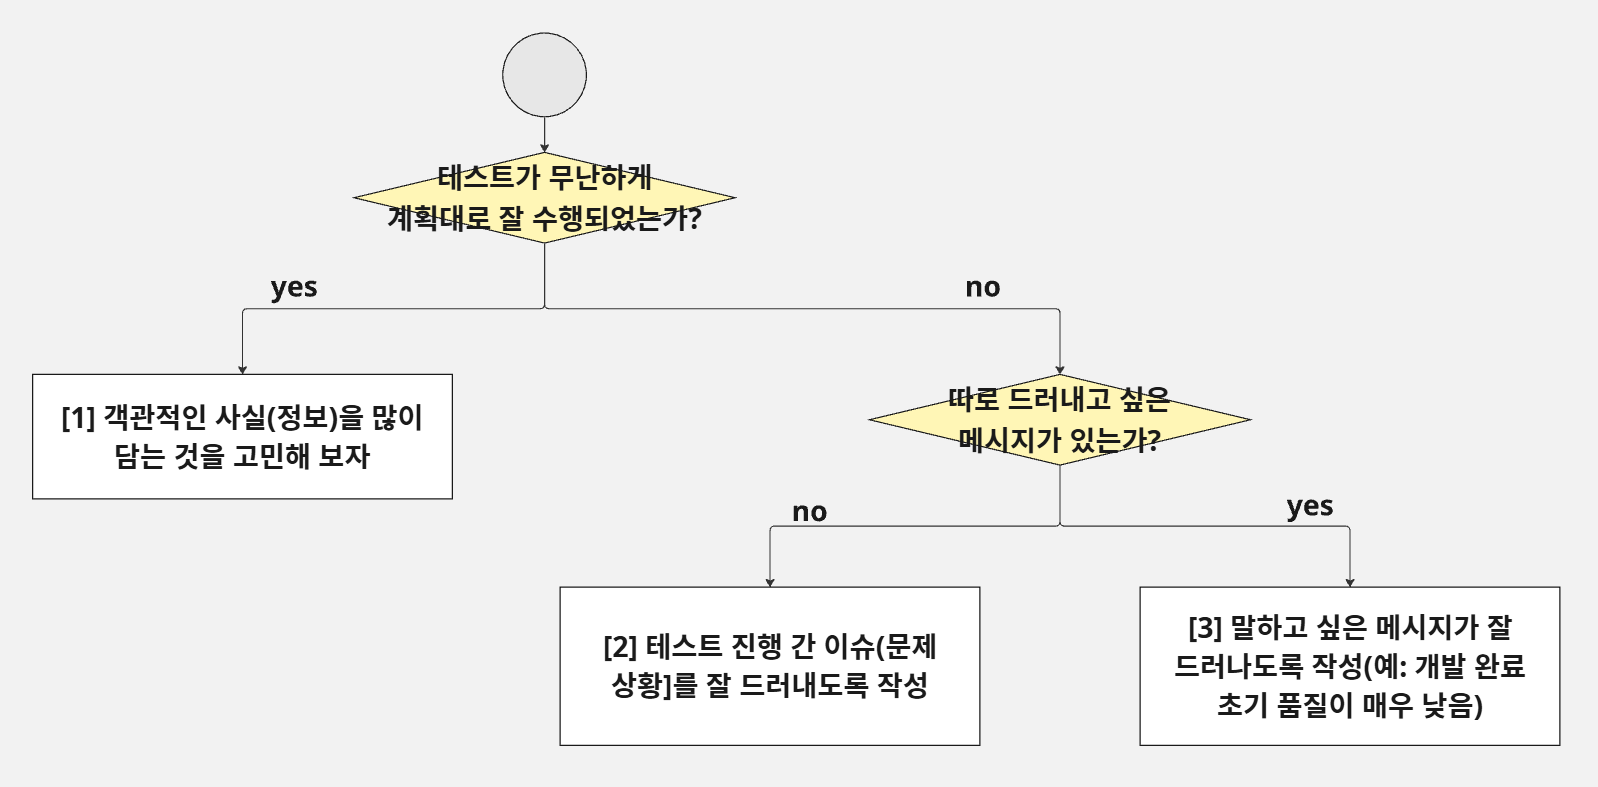
When I think about my old test result reports, I realized they generally fall into three categories based on the answers to two questions:
a) Did the test proceed smoothly and according to plan?
b) Is there a specific message or concern I need to highlight?
Depending on the answers, you can choose one of the following approaches:
[1] The Fact-Oriented Report
Use this when things went as expected.
- Content: Overview, objectives, methodology, and coverage.
- Comparative Data: Distinctive features compared to previous similar tests (e.g., defect rates relative to lines of code or test cases, average days to resolve defects).
[2] The Issue-Oriented Report (Highlighting Obstacles)
Use this when the testing process faced significant hurdles.
- Content: High volume of unexecuted TCs, difficulties in environment isolation or data acquisition, a high rate of "Not a Bug" resolutions, etc.
[3] The Message-Oriented Report (Advocacy Focus)
Use this when you need to drive a specific point home.
- Content: Evidence of low initial quality (e.g., comparison of first-run pass rates) to justify future resource needs or process changes.
[0] Common Core Elements
Regardless of the lens, every report should include these basics (based on my actual project captures):
- Test Overview: Reuse the test plan content, but specifically note any deviations.
- Example: Ended testing after Round 1 (of a planned 2-round cycle) due to specific issues.
- Test Schedule: Compare planned vs. actual dates and explain any variances.
- Test Environment: If you had to use the Dev environment because the QA environment wasn't ready, document it.
- Tip: This serves as critical evidence if code management issues arise later.
- Test Results: Display standard metrics (Execution rate, Pass rate, Defect resolution rate). If you closed the test conditionally (under 100%), state the rationale.
- Example: Legal review for Terms of Service was delayed. Mentioning this provides an "excuse" or grounds for re-verification if issues occur post-launch.
- Defect Details: Resolution rates. If not 100%, break down the "Deferred," "Not a Bug," "Known Issue," or "Cancelled" counts.
Note: I prefer to separate Residual Risks and Conclusions/Recommendations into a final "Sign-off" document if QA is responsible for the go/no-go decision, keeping the "Result Report" strictly to objective facts.
A Sample of Test Resut report.
A Sample of Test Resut report.
5.4 Test Results
Test Execution Overview
The test was originally planned in two phases; however, the scope was adjusted as follows:
- Phase 1 (Execution & Defect Verification):
- Full execution of planned test cases and verification of individual bug fixes.
- Phase 2 (Final Regression & Verification) - [POSTPONED]:
- Reason: Originally intended for a full re-test under "Code Freeze" conditions. However, due to ongoing discussions regarding new features, upcoming major milestones, and pending decisions on the final launch date/scope, Phase 2 has been put on hold.
Test Schedule
- Phase 1 Execution: 2023-05-02 (Tue) ~ 2023-05-12 (Fri) [2 Weeks]
- Defect Verification: 2023-05-15 (Mon) ~ 2023-06-16 (Fri) [5 Weeks]
- Phase 2 Execution: Postponed
Test Environment
- Phase 1: Conducted in the Development Environment(http://dev.xxx.com) due to the unavailability of a dedicated QA environment at the time of testing.
Test Metrics (Overall)
- (link) the link that can check the whole test results.
- Test Execution Rate: 100.0% (377/377 Test Cases)
- Note: 10 cases were "Blocked" due to dependencies on defects from previous stages.
- Test Pass Rate: 98.3% (373/377 Test Cases)
- Fail (4 cases): Related to Terms & Policies (Privacy Policy, Terms of Use, AI Utilization, Notification Settings). These were marked as "Fail" because typos and undefined content were not finalized within the schedule.
- Defect Resolution Rate: 100.0% (95/95 Defects)
- Includes: 27 Cancelled, 27 Deferred.
- [Link to Jira Dashboard]
(Reference) Initial Test Results (Before Fixes)
- Execution Rate: 97.4% (373/383 TCs)
- Pass Rate: 68.4% (255/373 TCs)
Defect Status Breakdown
- Resolution Rate: 100.0% (98/98)
- Detailed Jira List: [Link] | Dashboard: [Link]
1. Deferred Defects (27 cases)
Issues classified as low frequency/impact or those where the fix direction is currently undecided.
- [EA-266] Requires verification of 4 Terms of Service items (placeholders like [date], [email address] remain).
- [EA-265] Automatic redirect to login page upon session expiry, even on public pages (Home, Discover).
- [EA-260] Multi-user boards: If one user deletes an image, others can still attempt comments/reactions despite server errors (data is not saved).
- [EA-255] Need for a dedicated error page when the server returns 5xx responses.
- [EA-240] Generation Page: Input values are cleared when switching between FullSentence and WordBlock tabs.
2. Cancelled Defects (27 cases)
Issues identified as "Not a Bug," unreproducible, or cancelled due to spec changes.
- [EA-219] Direct input in the top WordBlock is disabled (as per intended design).
- [EA-125] (API) Image deletion: Returns 204 instead of 404 when attempting to delete a non-existent image (confirmed as intended behavior).
Deep Dive: Specialized Content
[1] Fact-Heavy: Demonstrating Maturity
If the project was "business as usual," use these metrics to show that development and testing maturity are stable:
- Defect Rate per TC: A downward trend proves quality activities are working. If it’s higher, investigate if it's due to a larger volume of changes.
- Defect Rate per LOC (Lines of Code): A more objective measure of dev quality. (Though complexity should be noted as a variable).
- Initial Pass Rate: Comparing the success rate of the first run against previous versions helps identify early-stage quality trends.
[2] Issue-Heavy: Highlighting Risk
If you "powered through" a messy process, make sure those risks are visible:
- Blocked TCs: Explicitly list which areas couldn't be tested and why. These are "potential landmines."
- Conditional Exit: If you stopped testing despite failures, document the stakeholders' agreement and the reasoning.
- Environmental/Data Integrity: If the data was limited or the environment was "unclean," note that the results may not fully reflect real-world performance.
[3] Message-Heavy: Communicating Quality Concerns
When the initial build quality is poor (a common complaint I hear from QA leads), use data to speak for you:
- Initial Pass Rate: A disastrous first-run pass rate is hard evidence that the build was handed over prematurely, causing high overhead for re-testing.
- Defect Severity Ratio: A high percentage of "Critical/Major" bugs usually blocks the path to finding smaller, more nuanced defects.
- Defect Density by Module: Identify "hotspots" or specific functional areas that are prone to failure. (Focusing on functional areas is often more professional than targeting individual developers).
Conclusion
Summarizing and sharing test results is not a mundane, clerical task. It is the "Endgame" of Test Engineering. It is where data meets strategy. Let’s strive to turn our reports into the "Art of Testing."
'SW 테스트 실전' 카테고리의 다른 글
| (사례 모음) 애자일 테스트 프랙티스 정의와 수행 사례 (1) | 2025.04.11 |
|---|---|
| (기고) 다시쓰기 - "검증 일정(주기)을 줄이는 방법" (0) | 2025.04.11 |
| (기고) 테스트 일정을 줄이는 방법? (0) | 2025.04.11 |